About Survival Analysis
Monthly survival analysis about Proteins, Phosphosites, Acetylsites, and RNA can be found here.
High and low groups were defined based on the median or mean value, and a survival plot was generated for each gene.
The plot titled 'Subtype Survival Analysis' next to the search box displays a survival plot by subtype, independent of any specific gene.
Basic functions
1. Get a list that satisfies a condition
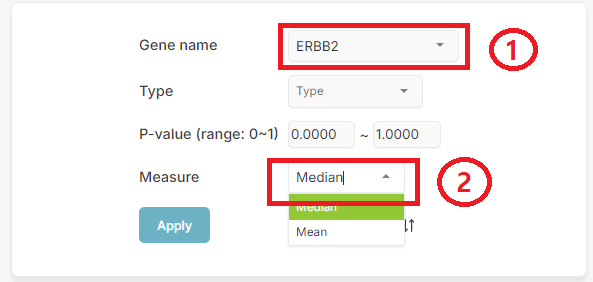
In the first box (1) as shown below, select your target. The third dropdown requires you to select either 'median' or 'mean' (2).
The 'Type', second dropdown lets you select one of RNA, Protein, Acetylsite, or Phosphosite. If no selection is made, it will display all plots corresponding to these four types.
The initial p-value range is set from 0 to 1. By adjusting the p-value range, you can view survival plots that meet the specified conditions.
Clicking the [Apply] button generates survival chart and its respective P-value.
2. Generating the line chart
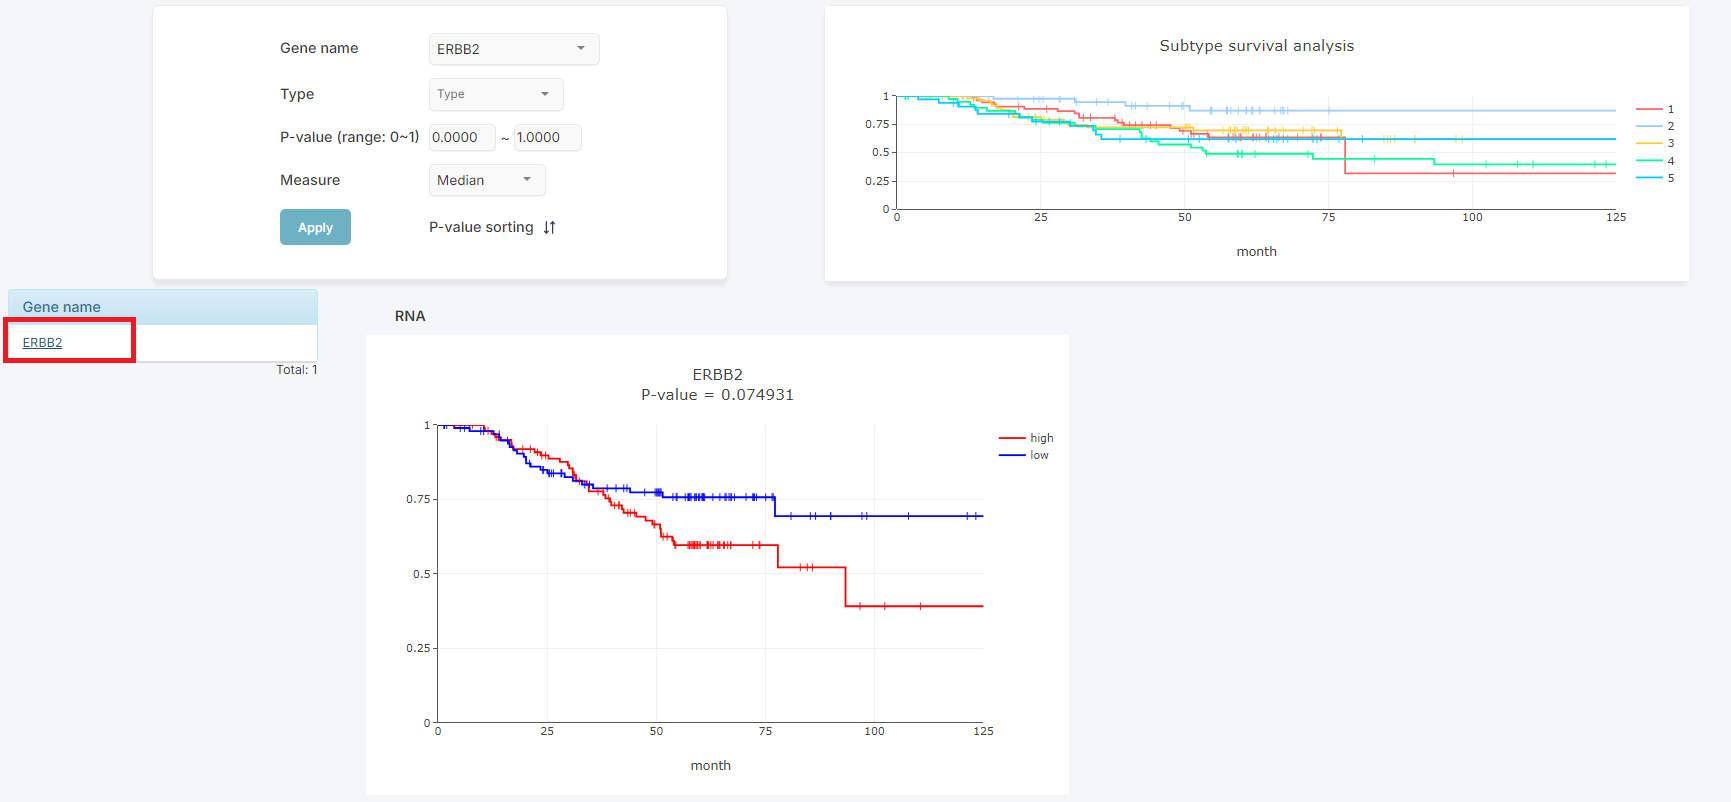
If you click on a gene name in the list, the corresponding survival plots are displayed on the left.
3. Result Sorting
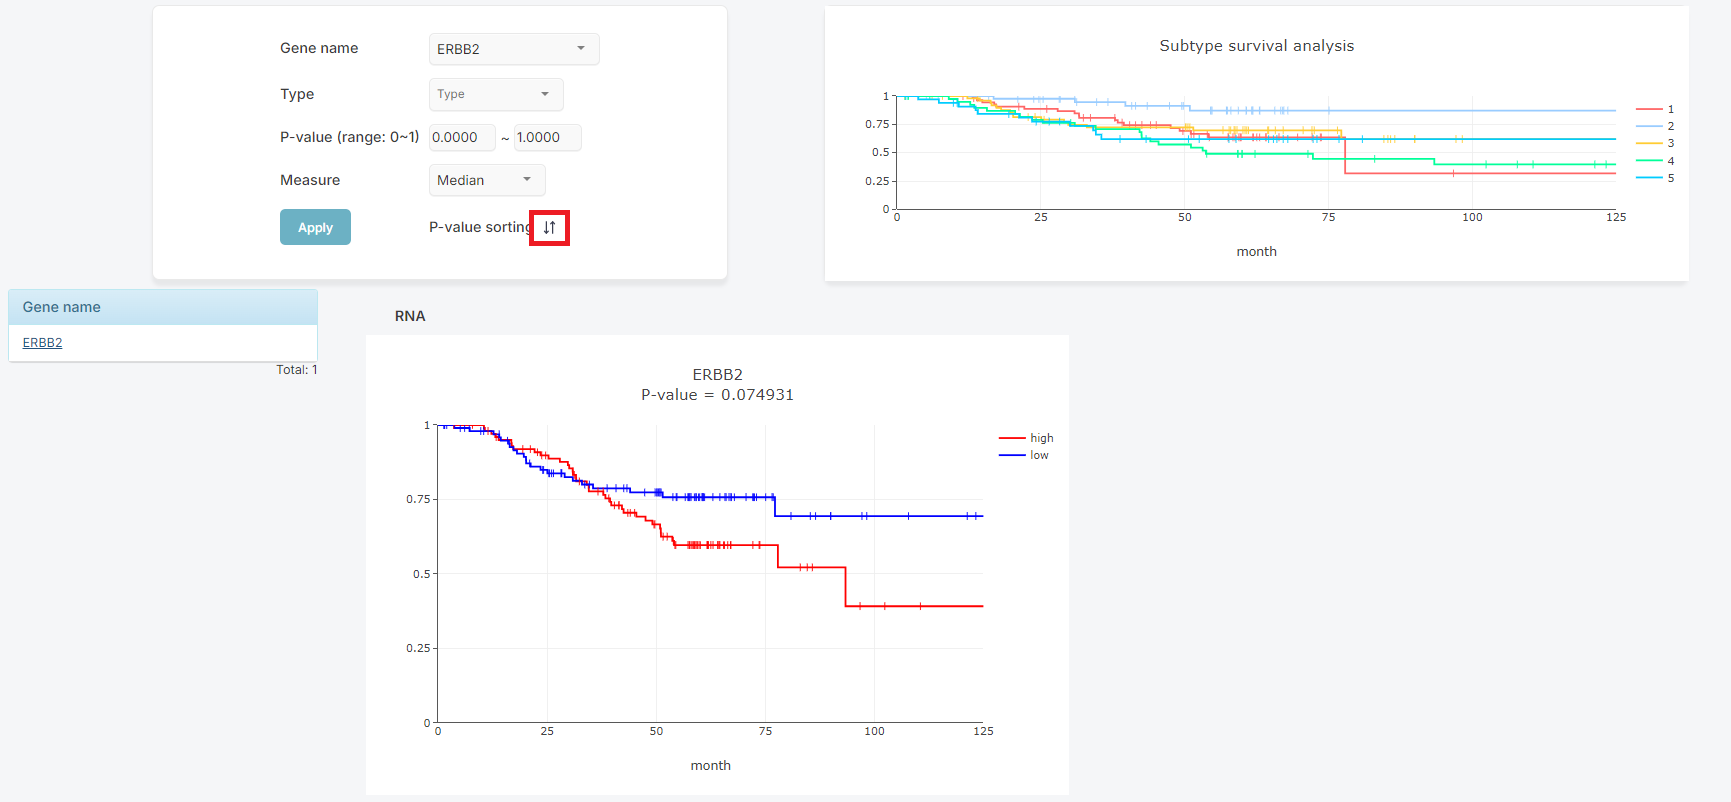
Search results can also be organized by its P-Value in the same type data.
Tab funtions
1. Image Size Adjustment
How large the image appears on the screen can be adjusted using the zoom in and out buttons.
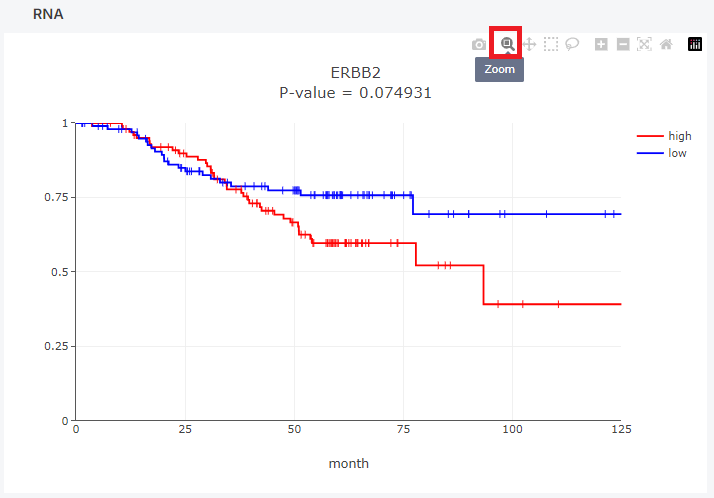
2. Saving Visualized Data
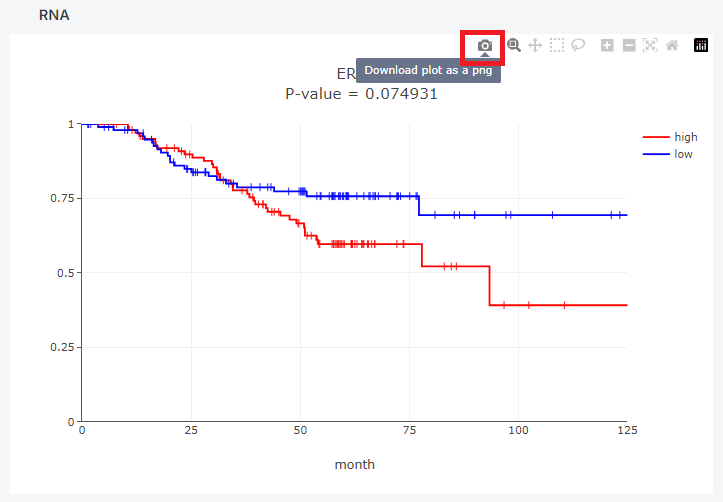
The resulting plot can be saved by pressing the save image button as shown below.
