About Immnue Cluster
Immune cluster data can be used to check the relationship between genes and patient information.
The Immune cluster page displays quantitative values for tumor patients.
Basic functions
1. Click the [Apply] button
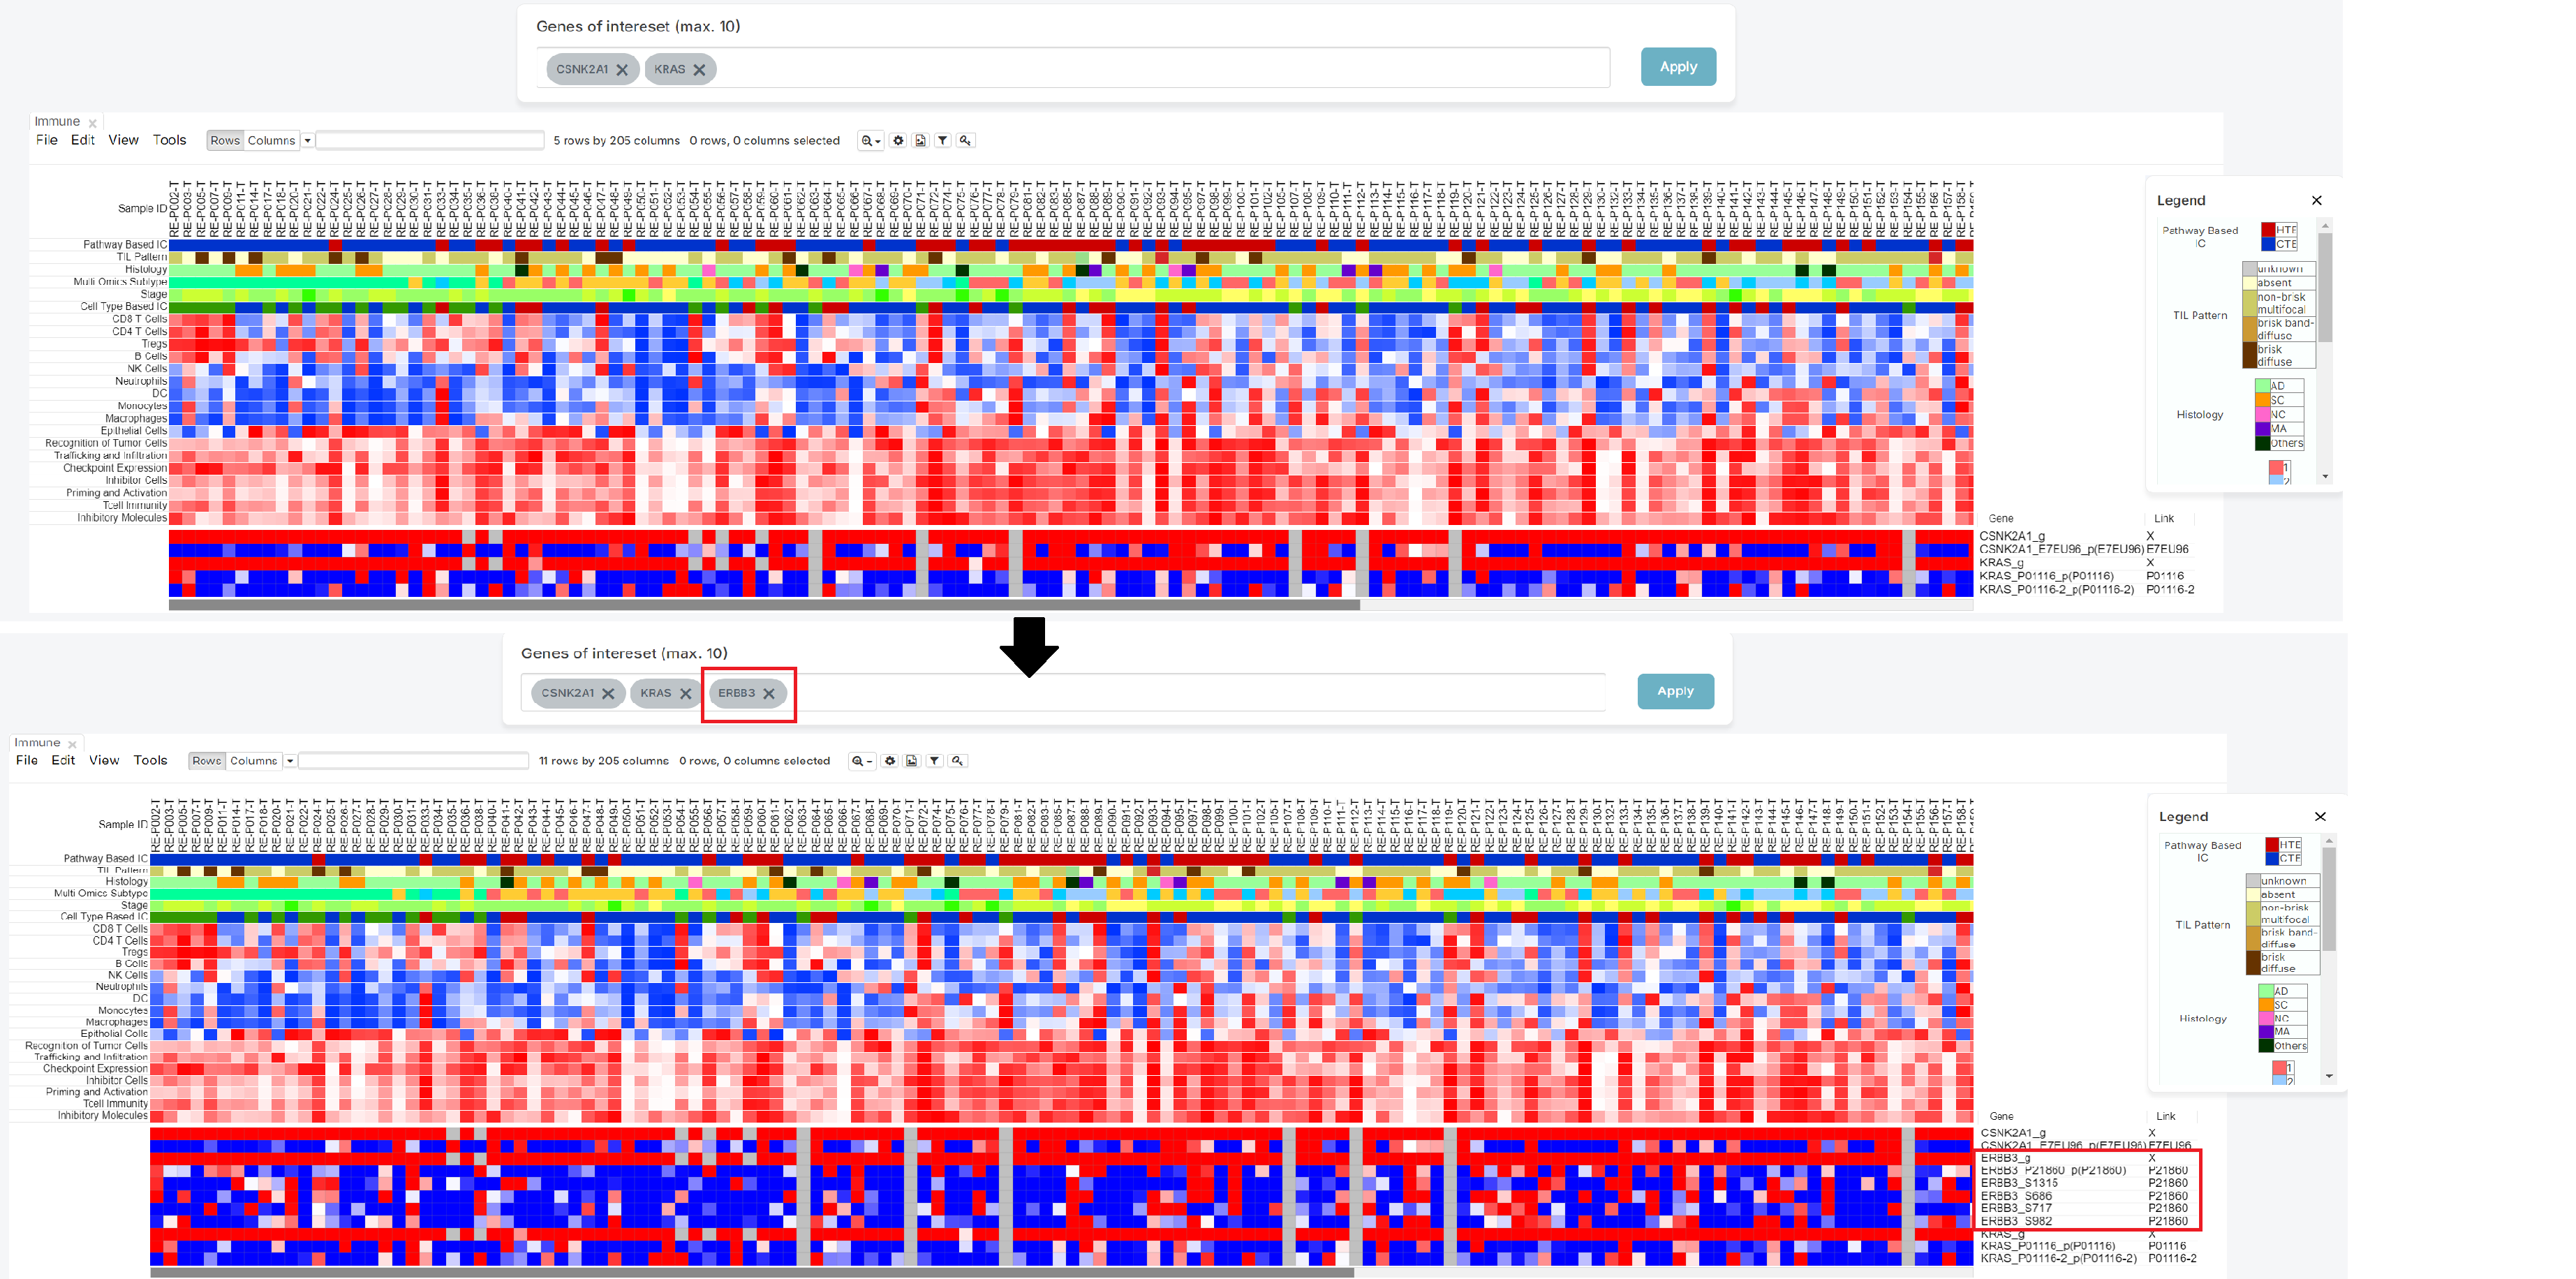
To utilize specific genes, in the 'Genes of interest' bar find and select up to 10 genes (1).
After filling the box with your desired inquiries, please push the 'Apply' button (2).
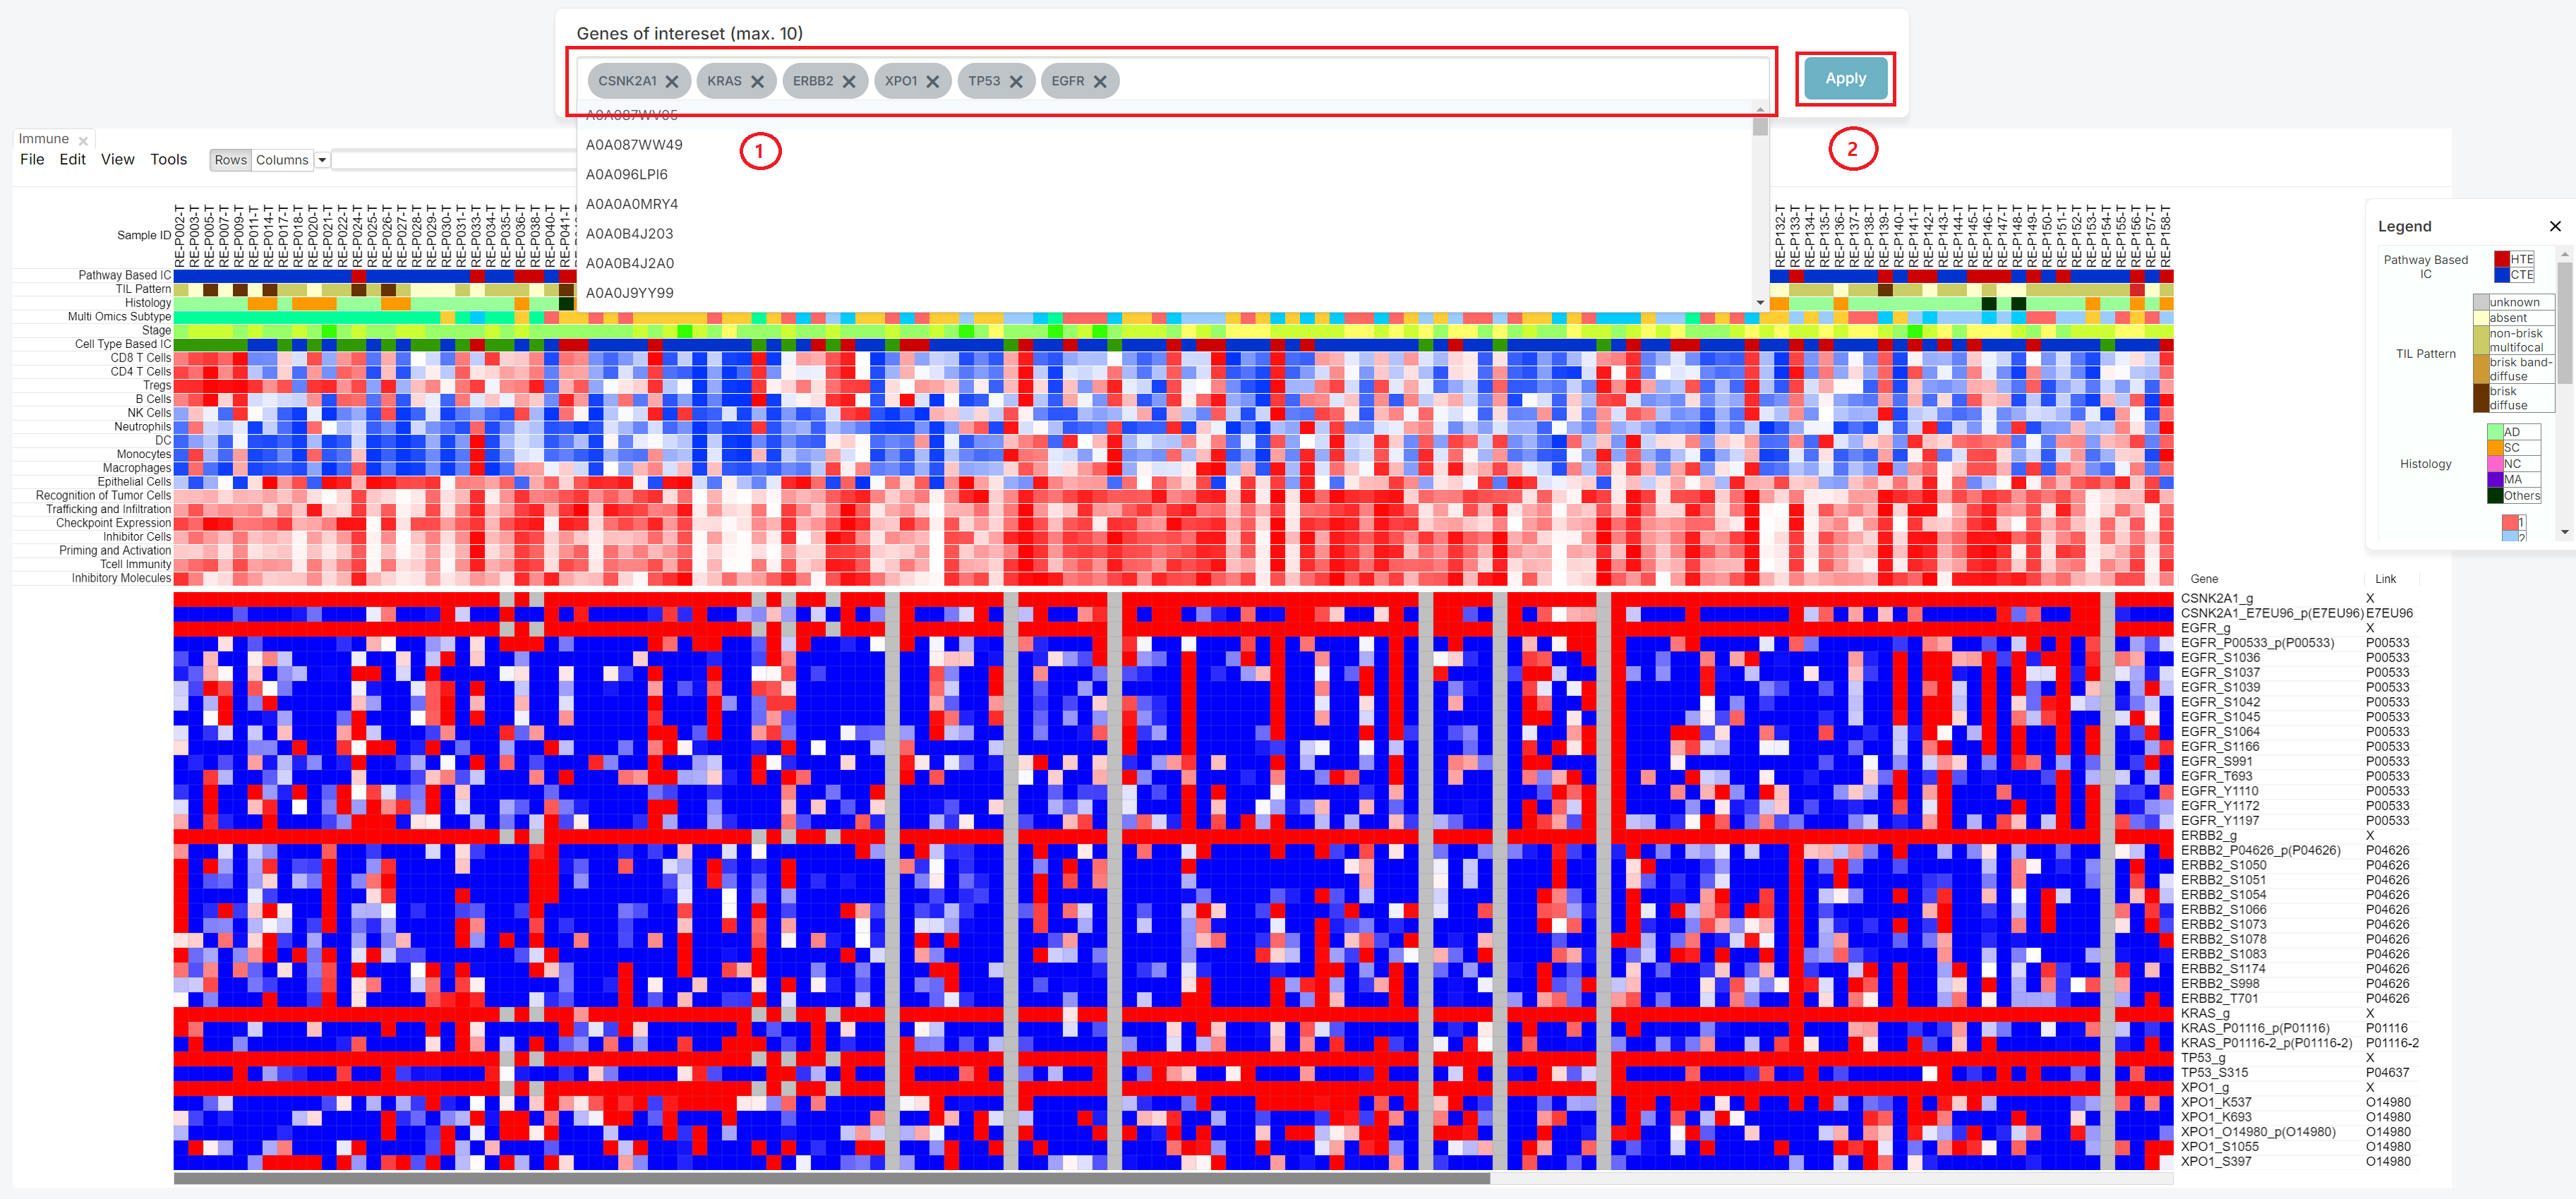
As shown below, the heatmap produced from your search can then be used to determine the relationship between patients and genes of your choice.
2. Click the [Legend] button
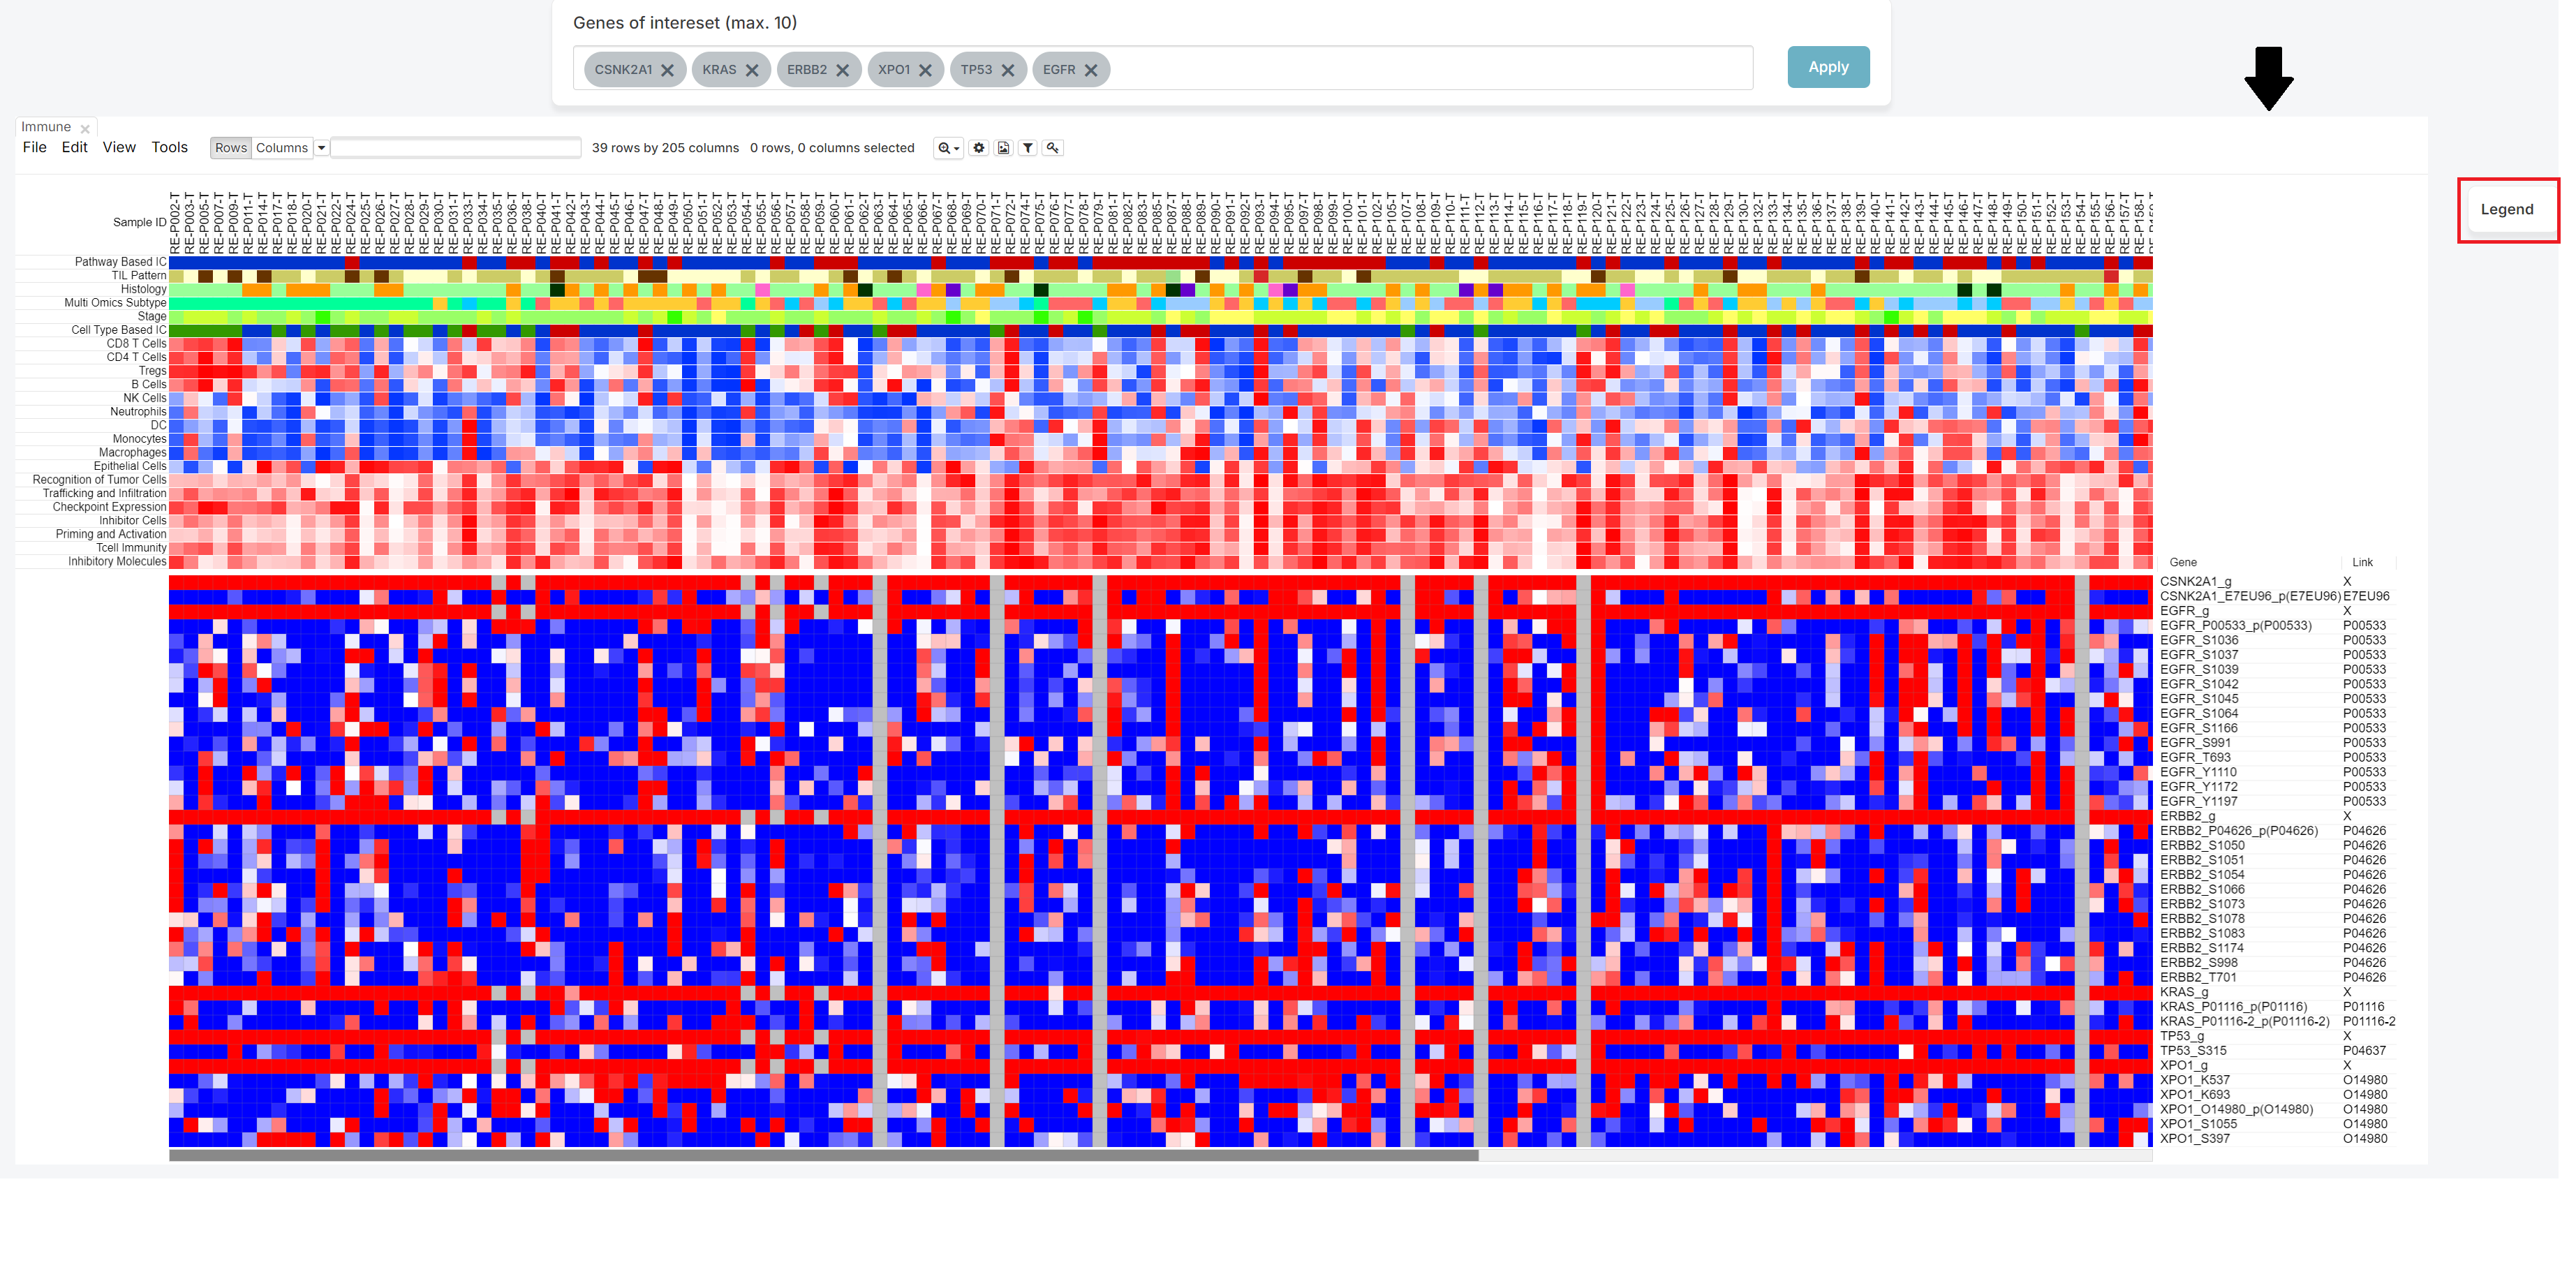
The legend is initially expanded when the screen opens. You can hide it by clicking the 'X' button, or expand it again by clicking the 'Legend' button, depending on your preference.
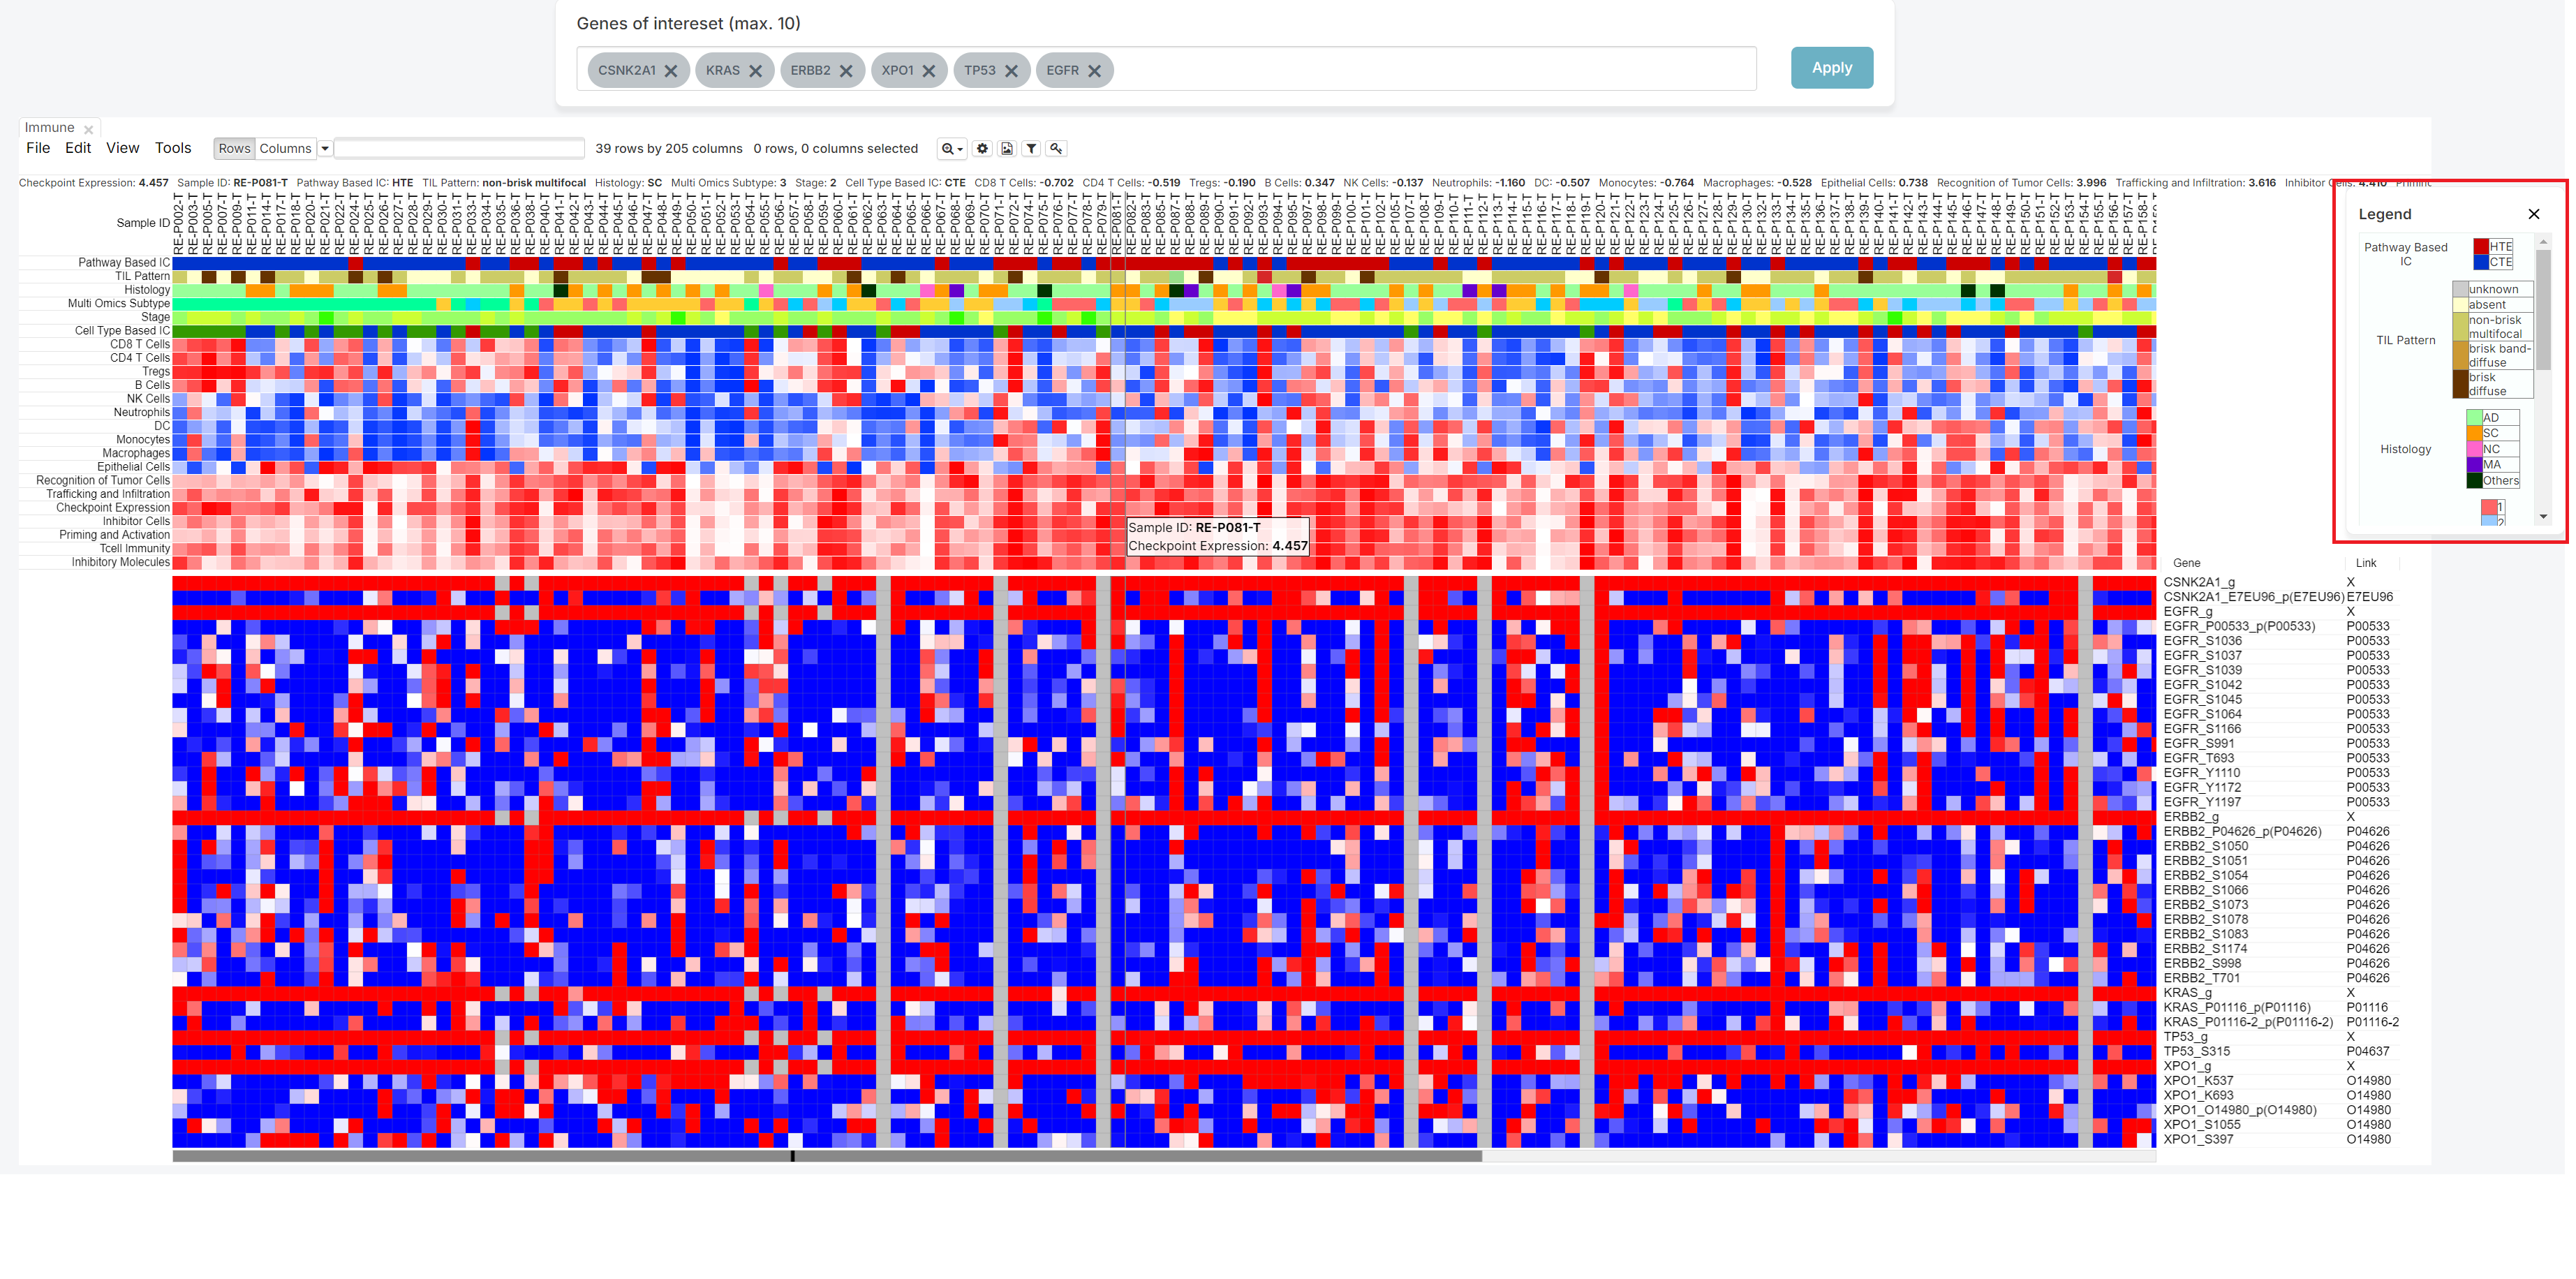
If you click the 'X' button, you can get hide the legend.
3. Click the [Link] column
You can see the Link column on the right side.
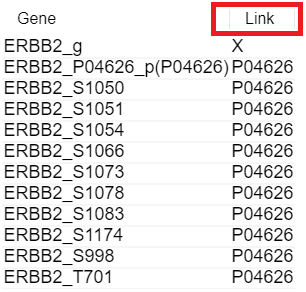
It means the Uniprot ID which have relationship with gene.
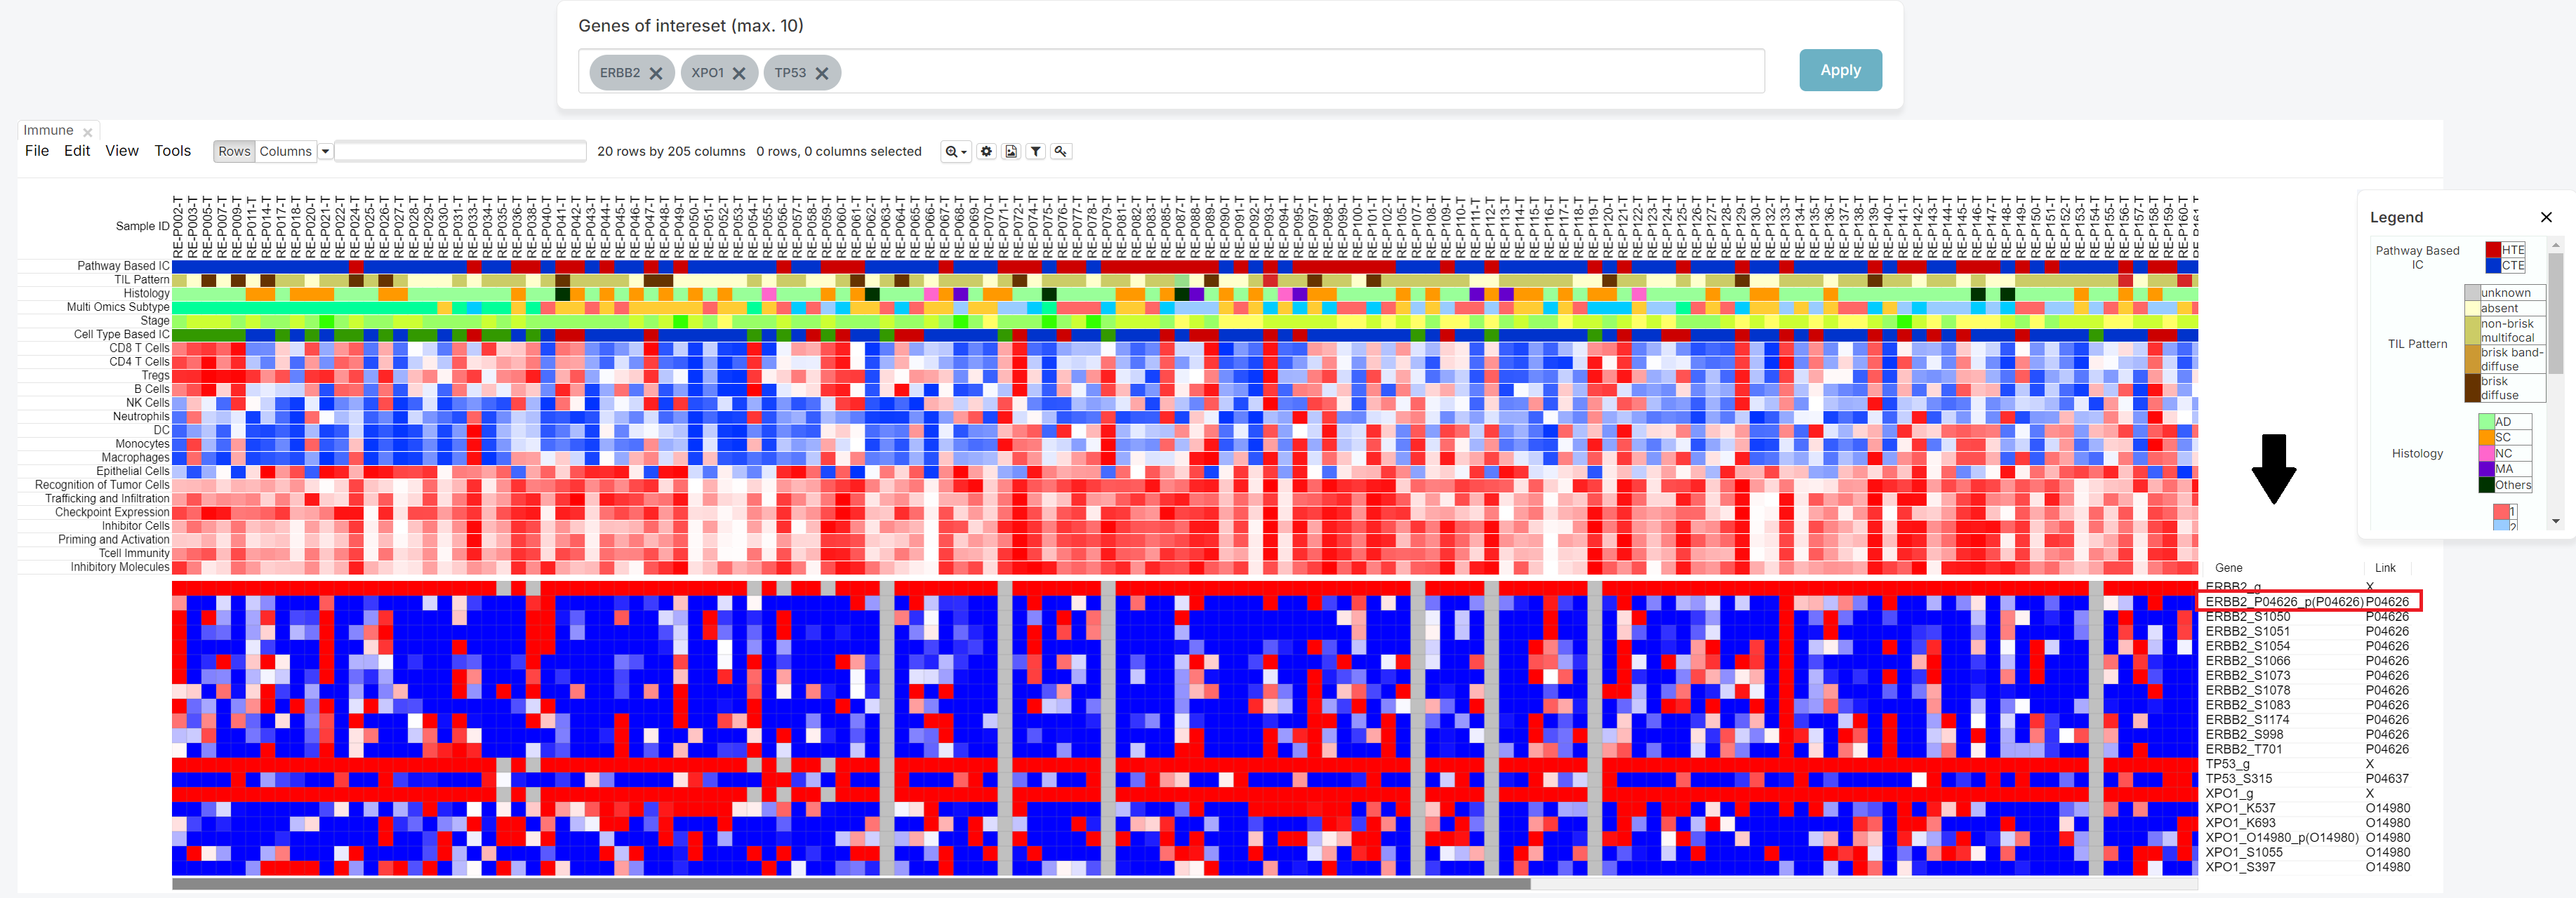
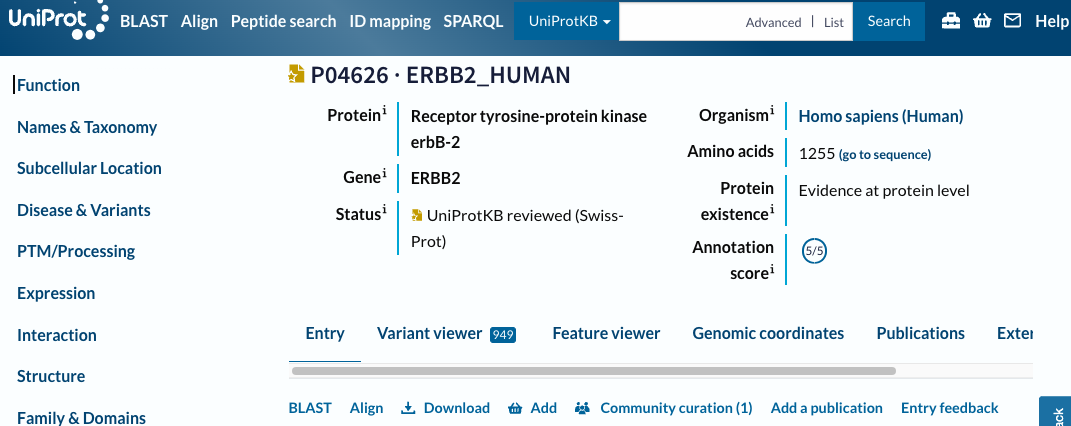
It has a hyperlink to connect Uniprot site.
Therefore, if you click that ID, not starred 'X', you can move to Uniprot site.
4. Meta data sorting
If you want to sort by the value of meta information, click the meta column name.
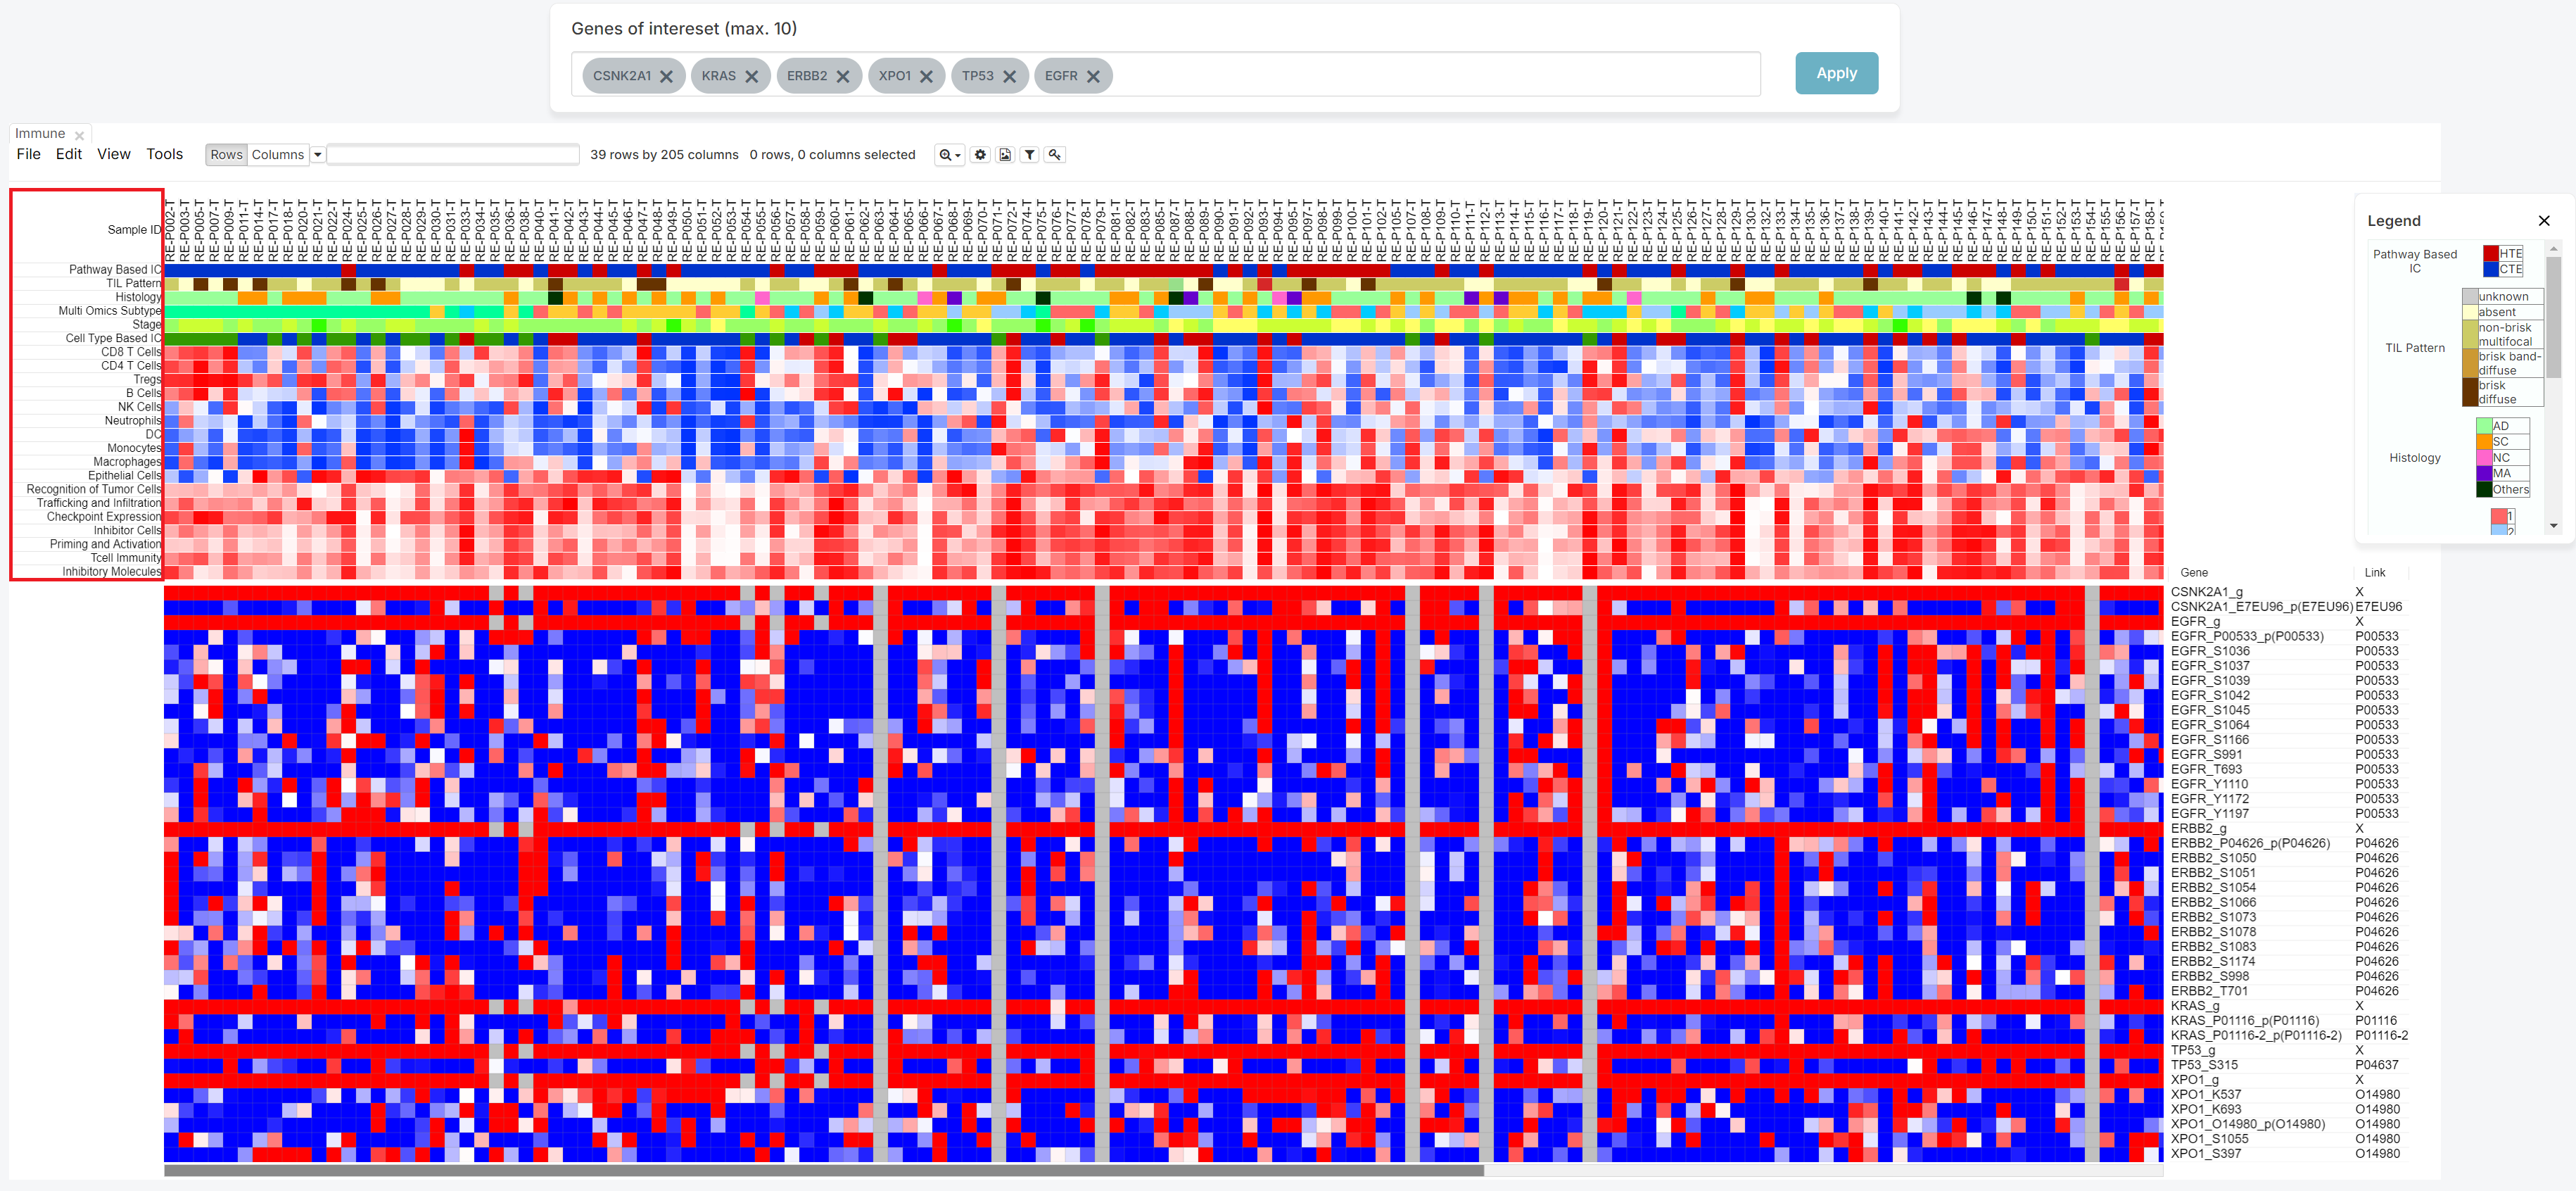
The first click on the same column name will sort in ascending order, the second click will sort in descending order, and the third click will disable the sorting function.
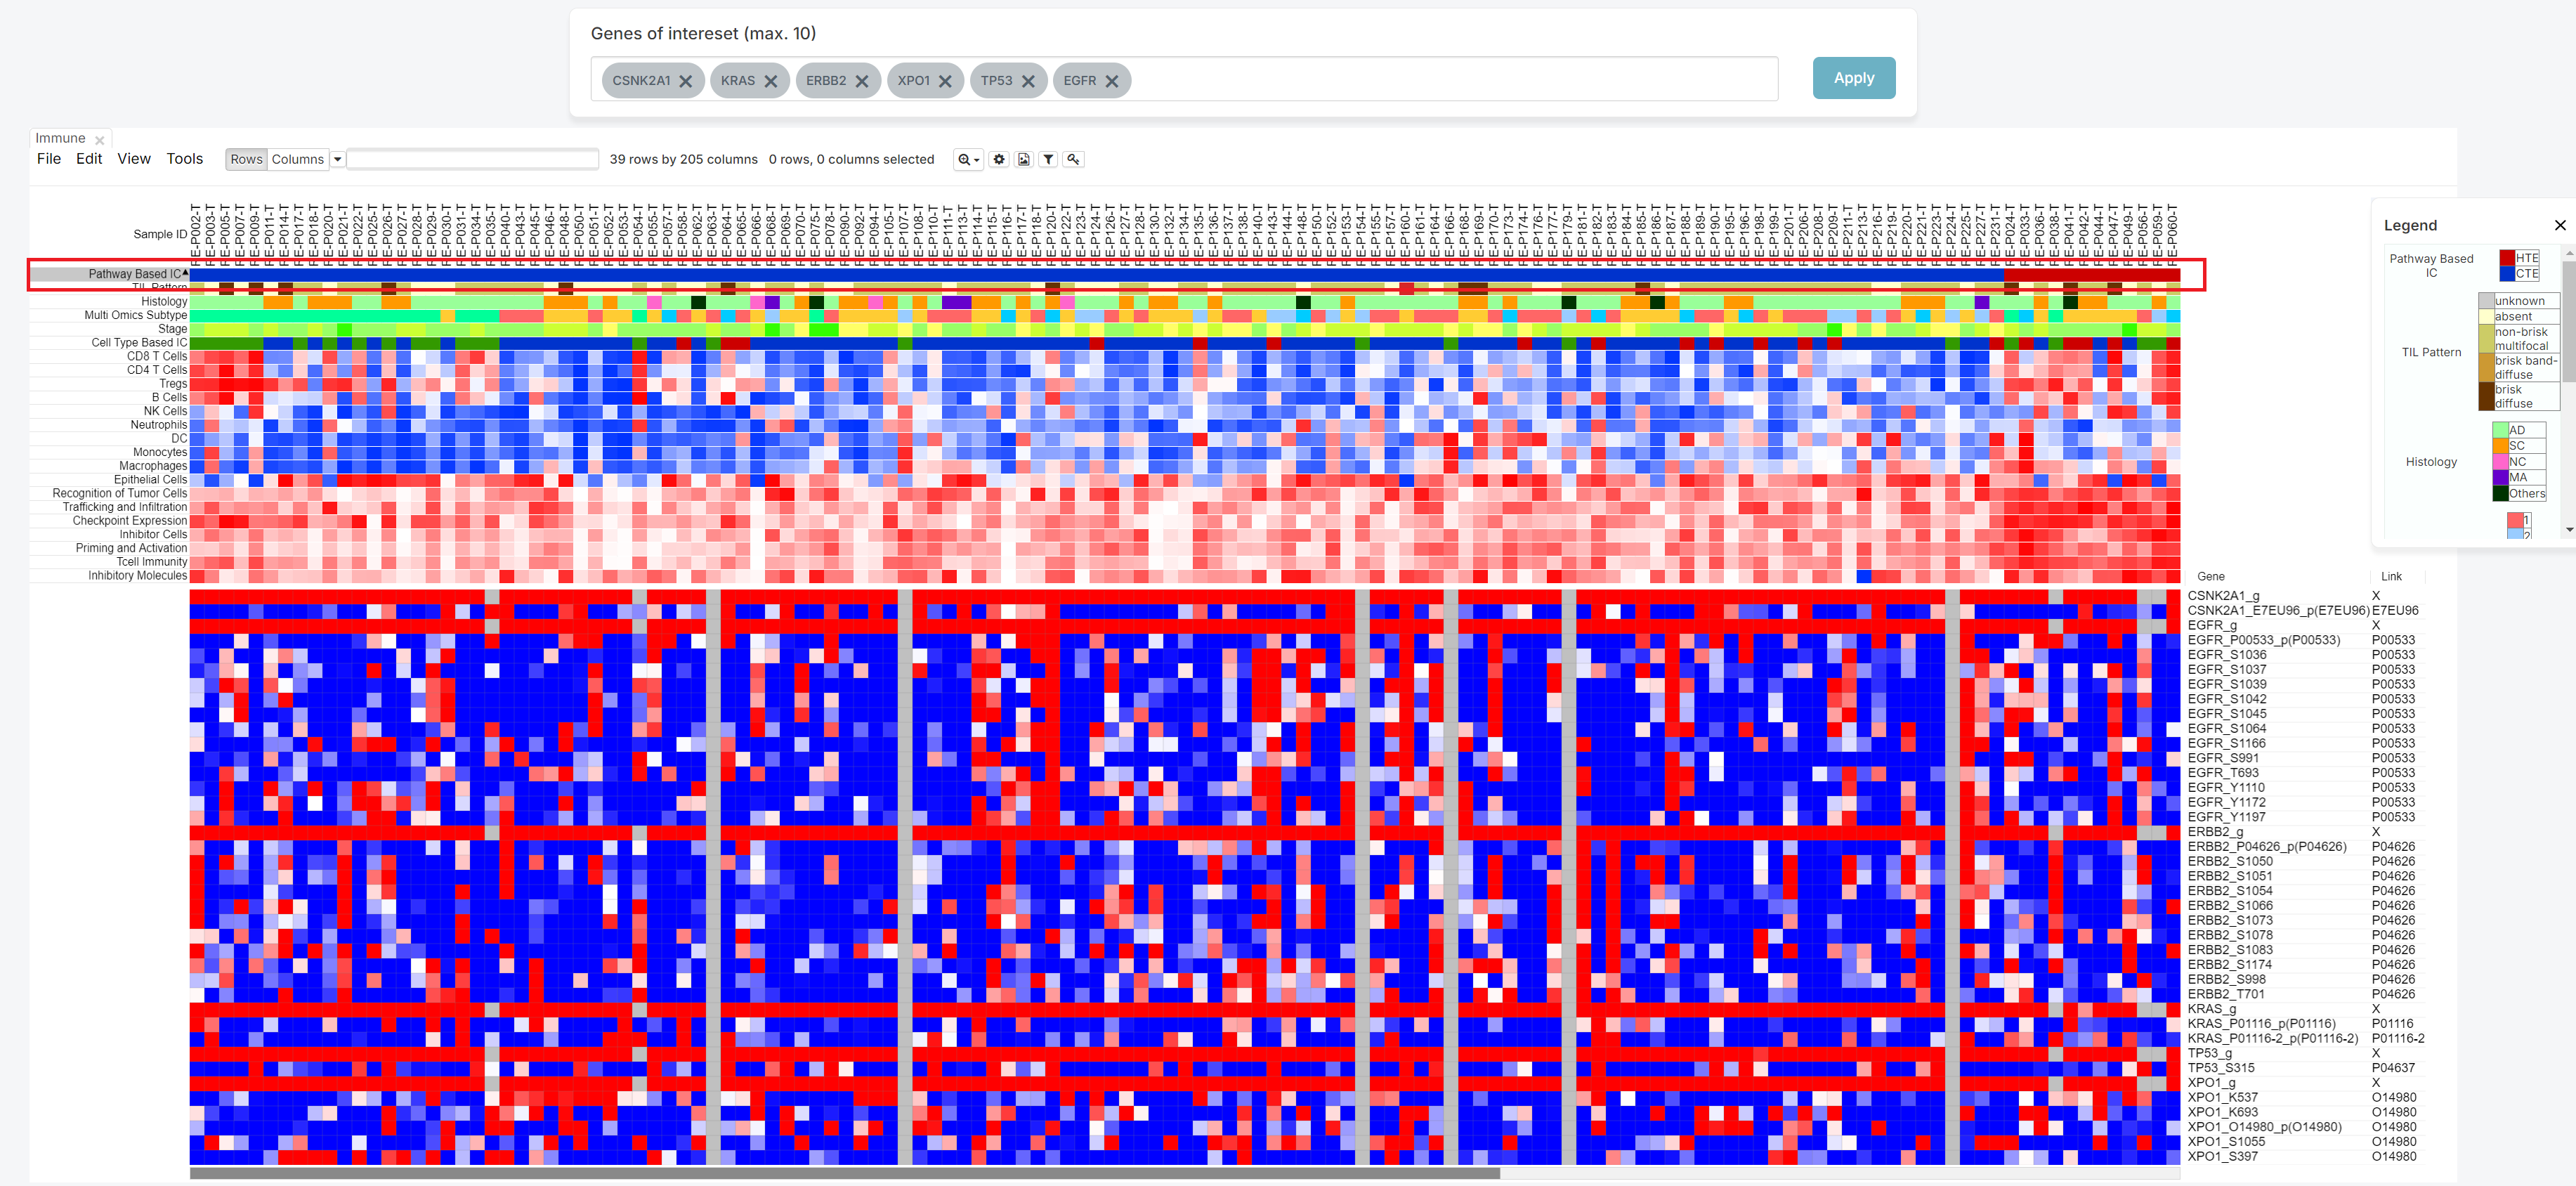
5. Legend information
| Pathway Based IC | HTE or CTE status from clustering analysis based on pathway enrichment scores for Immunogram. |
|---|---|
| TIL Pattern | The pattern of tumor infiltrating lymphocytes (TIL). |
| Histology | Name of pathological diagnosis classification for using this study. (AD :Adenocarcinoma , SC : Squamous cell carcinoma, MA : Mucinous adenocarcinoma, NC : Large cell neuroendocrine carcinoma and others) |
| Multi Omics Subtype | NMF subtypes of patients with NSCLC in this study. |
| Stage | Tumor stage |
| Cell Type Based IC | HTE or CTE status from clustering analysis based on cell type enrichment scores using xCell. |
| CD8 T Cells | Enrichment score of CD8+ T cells. |
| CD4 T Cells | Enrichment score of CD4+ T cells. |
| Tregs | Enrichment score of regulatory T cells. |
| B Cells | Enrichment score of B cells. |
| NK Cells | Enrichment score of natural killer cells. |
| Neutrophils | Enrichment score of neutrophils. |
| DC | Enrichment score of dendritic cells. |
| Monocytes | Enrichment score of monocytes. |
| Macrophages | Enrichment score of macrophages. |
| Epithelial Cells | Enrichment score of epithelial cells. |
| Recognition of Tumor Cells | Enrichment score of recognition of tumor cells pathway. |
| Trafficking and Infiltration | Enrichment score of trafficking and infiltration pathway. |
| Checkpoint Expression | Enrichment score of checkpoint expression pathway. |
| Inhibitor Cells | Enrichment score of inhibitor cells pathway. |
| Priming and Activation | Enrichment score of priming and activation pathway. |
| Tcell Immunity | Enrichment score of T cell immunity pathway. |
| Inhibitory Molecules | Enrichment score of inhibitory molecules pathway. |
Tab funtions
It consists of Morpheus functions.
Therefore, if you want to check how to use tab function, please follow the Morpheus tutorial.